An effortless and comprehensive approach to burden of illness reviews
Blog - PRO Tools for Caregivers
Published: 09-10-2018
The burden of a disease on caregivers is an important indirect cost. Our aim was to assess the availability of PRO instruments to measure this burden and the current patterns of use.
Method:
Using the specialised search filters in the heoro.com database, and importing the results into a custom Evidence Map, we have identified interesting patterns of use for PRO tools assessing caregiver-reported outcomes.
We ran the search from 1960 to 2018 and analysed the abstracts identified by the search to determine the range of geographical locations, disease types, interventions and study methodologies. Using the PRO filter, we identified studies in the database that were published between 1960-2018 that used an instrument to assess caregiver-reported outcomes. We excluded instruments that were disease specific.
Results:
Using an Evidence Map to present the findings we were able to easily explore the results. To download a free copy of the map click here. To use the Map, open it in Excel and enable macros.
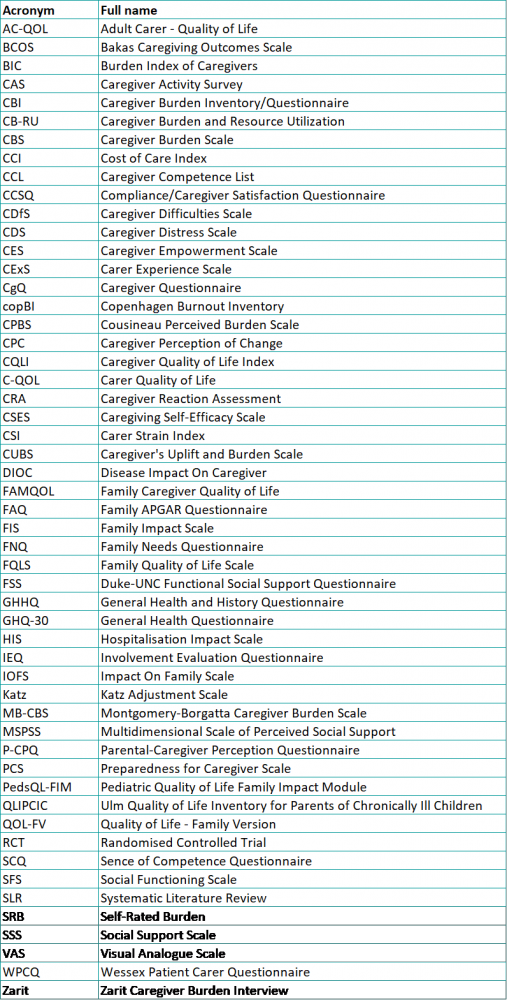
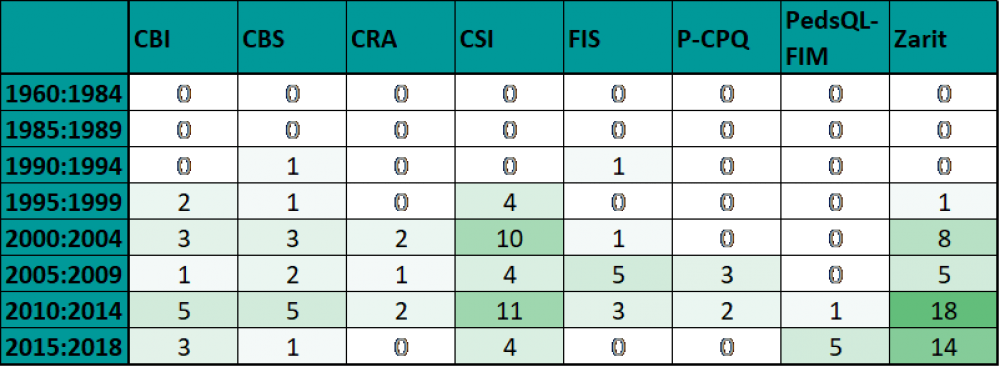
A wide range of PRO instruments are available to measure caregiver-reported outcomes (a list of instrument names and abbreviations can be found at the end of the blog). However, very few instruments were used widely. We found only 8 instruments cited in the abstracts of more than 5 papers each. Table 1 presents the 8 instruments along with the distribution of years the paper were published.
Table 1: Publication counts for the most cited PRO instruments by year of publication
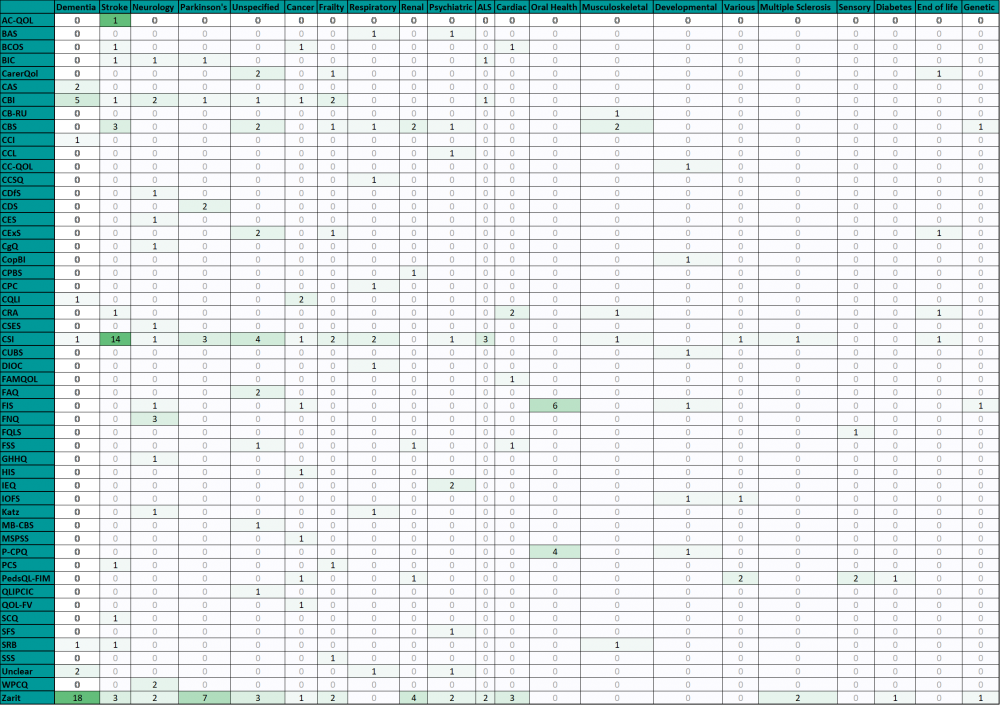
We found a wide range of disease areas covered in the papers, highlighting the generalisability of the instruments included in the search, however the majority of studies focussed on neurological and long-term degenerative diseases, as shown in Table 2.
Table 2: Publication counts for the PRO instruments by disease
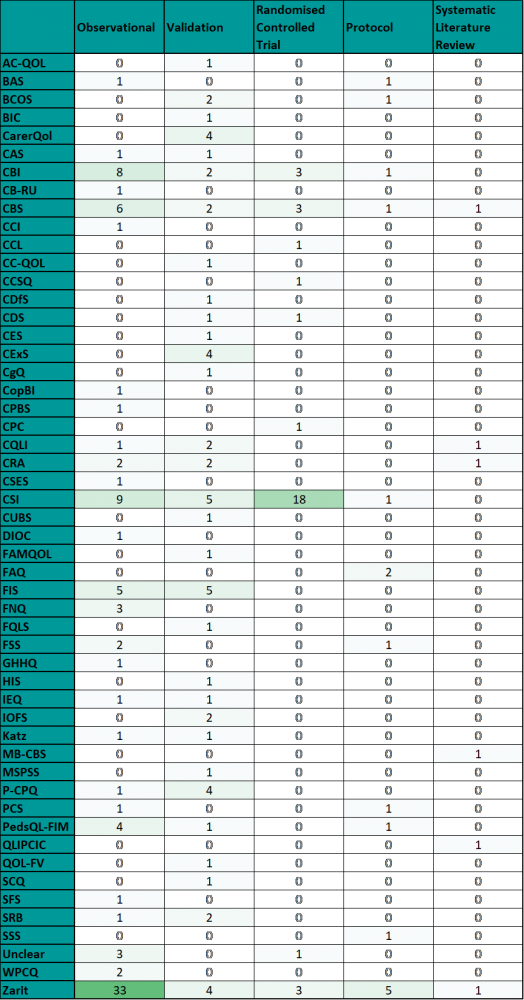
The most promising finding was that nearly half of the studies found to include one or more of the relevant instruments in some way assessed the reliability, responsiveness, or validity of the instrument. Table 3 shows the types of studies found and the instruments used in them.
Table 3: Publication counts for the PRO instruments by study type
This summary of data is only a snapshot of the patterns presented in the Evidence Map. The Evidence Map allows inspection of the distribution of evidence for the PRO tools, study type, study location, population assessed, disease indicated, year of publication, and any two-dimensional comparison.
To download a free copy of the evidence map click here.
Written and created by
Cassandra Springate
Senior Researcher at Crystallise Ltd

Appendix 1: Abbreviations Table